Growing up in the Northern Virginia exurbs, my first real exposure to rail transportation was when I would visit my grandma in New York every summer, though if I had been born 50 years earlier, this would not have been the case.
The Leesburg station, which would have been my station growing up. // Photo courtesy of Reed Brothers Dodge History
The Washington & Old Dominion Railroad once served the stretch of land from Arlington, Virginia, to Purcellville, Virginia, containing most of Virginia’s portion of the DC suburbs, connecting what was once a major port and manufacturing city a stone’s throw from the nation’s capital to agricultural lands near the Blue Ridge Mountains. Like many other rail projects of its time, its fate was doomed, as the tracks were removed in the 1960s and 1970s in favor of car-oriented development in the region.
Despite the removal of the railroad, the right-of-way remains a crucial piece of infrastructure in the area, as it is now a recreational greenway for horses, cyclists, walkers, and runners to enjoy. Known as the W&OD Trail, it opened in 1974 but was fully completed in the late 1980s. In an area that is so car-centric, this trail was a crucial part of my own childhood, as it is easily accessible from many neighborhoods and connects numerous schools in the area.
Only a few years after the closing of the W&OD railway, however, rail transportation began to see a resurgence in the area. The DC suburbs overall saw rapid growth in the late 20th century into the 21st century, and commuters sought a different way to traverse the region. Though obviously there was once rail in the same area, planners made the now-controversial decision to place lines along freeway medians. Though this largely placed the trains out of earshot of people’s homes, if you have taken the Metro in Northern Virginia, you can likely relate to the inconvenience of walking from a sprawling parking lot or through a dark garage, then over the freeway, to finally stand in the median, listening to the roar of cars passing by. The experience is similar to that of waiting for a train at the Rockridge BART station.
Throughout my lifetime, the Metro has expanded, but has often occurred through transit-oriented-development, rather than serving the existing communities which sit along the W&OD trail. This could have been a great opportunity to revive many of the sleepy downtowns along this corridor, but the W&OD Trail’s existence prevented this from occurring.
Rail-to-trail projects like the W&OD Trail can fall into the same trap as historic preservation. Both phenomena can preserve the form of a community, without making the most of its function. Though I cherish the experiences I had running on the W&OD Trail when I was younger, as a city planning student, I can’t help but think about the alternatives for that space.
High Line
Elsewhere in the United States, rails to trails projects are massively popular, and appear poised to become more common moving forward. New York City’s High Line, once used for freight trains, is a 1.5 mile long path along Manhattan’s West Side. Unlike many other rail to trail projects, the High Line also has scenic overlooks, bleacher-style seating, and spaces for community programming. In a portion of a city with no shortage of trains, the High Line is a form of green infrastructure which complements the existing public transit and active transportation network.
Photo courtesy of Alexandr Spatari // Getty Images
Belt Line
For those seeking inspiration for using their city planning degree in the green infrastructure space, look no further than Atlanta, where then-Georgia Tech student Ryan Gravel translated his learning into his vision for the city’s plans for a massive rail-to-trail project. In his graduate capstone project, Gravel points out the racist and unsustainable implementation of transit and highway infrastructure alike in Atlanta’s past, while proposing a new way to revitalize the city’s downtown in an inclusive manner. Opened in 2005, the 22 mile long Atlanta Beltline circles the urban core of the city, providing residents with a new way to get around the city without a car or by being at the mercy of the limited transit options available.
With a project as large as the Beltline, scholars have raised concerns about its role in furthering gentrification. Despite the project’s vision to undo the harm Atlanta’s infrastructure has caused, its impact may follow this historical pattern in some ways. Per the New York Times, a portion of the Beltline passes through the historically Black neighborhood of Bankhead, with a ~$27,000 median household income, and homes within half a mile of the Beltline have been proven to be much more valuable than those further away. The State of Georgia forbids local rent control ordinances, so without sufficient affordable housing along the Beltline, housing prices have jumped at rates outpacing the rest of the city.
As both a student and resident in Berkeley, I would be remiss not to mention the Ohlone Greenway, which mostly follows the BART right-of-way from the North Berkeley station through Richmond, connecting with other trails in the area. The Ohlone Greenway differs from the other projects mentioned above in that it is still very much part of an active train route, but the tracks are almost entirely elevated, allowing trains, bikes, pedestrians, and the occasional turkey to pass by simultaneously. The politics and noise pollution implications of the BART tracks are noticeable, but elevating them rather than laying them at ground level has made the right-of-way a cherished piece of green infrastructure. Of course, completely burying them largely solve the noise pollution concerns, but would likely be more expensive.
Photo courtesy of Julian Rocha // UC Berkeley
Conclusion
The examples from across the country are only a handful of the many existing or planned rail-to-trail conversions in the country. As someone who frequently travels along them but who also is a city planning student, I recognize that not all forms of green infrastructure are to be treated equally. Some, like the Atlanta Beltline, provide clear benefits but also contribute to gentrification and displacement. As planning (and planning-adjacent) students, we must remain mindful of these tradeoffs when tasked with designing or envisioning shared spaces. What are some other rail-to-trail projects that you have traveled on? Can you think of any other tradeoffs to these projects?
AC Transit Bus at Salesforce Transit Center (Alameda Post, 2023)
A Brief Introduction of Myself
At the age of 18, I rode public transportation for the very first time in my life and was amazed at the efficiency of the system to be able to transport hordes of people from one side of a city to the other. The year was 2018 and I was a freshman at San Francisco State University getting my B.S. in Environmental Studies with a concentration in Natural Resource Management/ Conservation and was new to the Bay Area. My daily commute on the Muni bus fascinated me as I was born and raised in California’s Central Valley where public transportation was barely accessible and rarely available. I immediately became a fan of public transportation, as I came from a world where everyone around me needed to have a car to survive (or if you were like half of the population of my hometown, a massive gas guzzling lifted pick up truck). I began to use public transit for everything! Occasionally I would even use it as my pick me up when I was having rough days (yes, I absolutely would cry in the very back of the bus and take routes where I could see the best scenes of San Francisco as a form of therapy).
Growing up in the Central Valley, I had become accustomed to some of the worst drought conditions in California’s history. When drought conditions peaked, my family and I would put a bucket in the shower to preserve any runoff available to water our dying lawn. In 2014, the town of East Porterville (a town less than 35 miles from my hometown of Visalia) completely ran out of groundwater (Glenza, 2015). This town was mainly made up of poor Latino farmworkers who had already been facing water issues for a while, such as poor water quality (Glenza, 2015). As a first generation Latina whose grandparents had come here to work in the fields during the Brazero Movement, a U.S.-Mexican government initiative post WWII that brought Mexicans over to work agricultural jobs, I was deeply concerned by the environmental effects that my communities were facing and wanted to figure out ways that we could best decrease our carbon emissions to prevent crises such as this.
Working my way through my B.S. in Environmental Studies, I felt a bit defeated as the classes often felt clouded by doomerism. We often talked about rising emissions, dying populations of rare species, disappearing old growth forests, large corporations polluting without consequences, it went on and on and on. But, one fateful semester I decided to take a course called Land Use Planning and things began to click for me. I began to learn about city planning and the connection between the built environment and carbon emissions. I slowly came to understand that the reasons I loved cities so much, the walkability, the public transportation, the density of neighborhoods, were some of the same solutions to lowering our carbon footprints. I immediately became hooked on learning about urban planning and added a Minor in Urban Planning to my undergraduate degree.
Fast forward to the present, and I am still a public transportation enthusiast and have taken this passion and transformed it into a career path. In the midst of pursuing my Masters of City Planning here at UC Berkeley, I was able to intern for the non-profit Civil Rights law firm, Public Advocates, where I was tasked with understanding needs based programs in public transportation systems (specifically the AC Transit system) and the ways in which cash reliant populations faced barriers to the system. Additionally, this research project has now transformed into my capstone project. Without further ado, after this long introduction about myself and how I have become a transportation enthusiast, here is a tidbit of the research I have been working on addressing the accessibility barriers to the AC Transit system!
Transportation & the Environment
According to the California Energy Commission, “California’s transportation sector accounts for about 50% of the state’s greenhouse gas emissions (GHG), nearly 80% of nitrogen oxide pollution, and 90% of diesel particulate matter pollution” (California Energy Commission, 2026). On September 23rd, 2020, Governor Gavin Newsom signed executive order N-79-20, which aimed to phase out the sale of gasoline powered vehicles and replace them with electric vehicles (EVs) (gov.ca, 2020). Though a step in the right direction, EVs are still to this day incredibly hard for lower income families to access. Studies have indicated that affluent households have adopted EVs at higher rates than low income households (though it should be mentioned that there are more and more programs being implemented to try and fix this gap) (Bauer, 2021).
While EVs are often framed as the primary solution to tackling our climate goals in California, they are not equally accessible to everyone. This pushes us to consider the alternatives that are much more equitable and just as or more impactful. According to the World Resources Institute, public transportation is one of the best solutions to tackle today’s climate challenges as it can reduce GHG emissions by two-thirds per passenger, per kilometer traveled as compared to travel on private vehicles (Welle et al., 2023). Additionally, for those who are low income and may not be able to afford purchasing an EV, it is crucial that if we are to reduce our GHG emissions from vehicles that we ensure that public transportation is incredibly accessible and affordable for all riders. Jumping into the next sections, we come to understand the everyday realities and barriers of AC Transit riders.
Cash Reliant Folks and Transportation Rider Demographics on AC Transit
On March 14th, 2025, the AC Transit Board of Directors voted to approve the increase of their bus fares over two phases (AC Transit, 2025). In the midst of a major financial crisis, the board approved two .25 cent increases over the course of two years which set the local adult fare to $2.50 when using Clipper Card. Unjustly, the agency increased the cash fare, often used by cash reliant communities (i.e. unbanked and underbanked communities), to $2.75, making cash fare users pay more to use the system than those who use Clipper Card (AC Transit, 2025). Once phase two is implemented on July 1st, 2026, this will increase the cash fare to a whopping $3, punishing those who rely on cash as their primary means of payment.
Currently, it is estimated that 2 million Californians “unbanked” and 5.5 million or more are “underbanked”. These terms are used to describe individuals who either have limited or no access to a traditional bank account, restricting them to rely on alternative financial services and cash as their main means of payment (McQuarrie, 2024). Historically marginalized and underserved communities have a higher likelihood of being unbanked with indigenous populations having an unbanked rate of 12.2%, Black populations with a rate of 10.6%, and Hispanic populations with a rate of 9.5% (FDIC, 2023). Furthermore, 22.4% of low income households are considered to be un/underbanked.
The same demographics that are more likely to be unbanked are the same populations that tend to ride public transportation at higher rates. According to the American Public Transportation Association, they reported that communities of color made up 60% of all public transit riders in the US (Clark, 2017). AC Transit has also reported that people of color make up 74% of their service area and found that low income riders are more likely to use their services 7 days a week as compared to higher income groups (AC Transit, 2023). Given the overlap in demographics and realities, it becomes critical that we examine how AC Transits system design and fare policies create major barriers for unbanked riders.
2024 Percentage of population in the East Bay who use public transit to commute to work, “pct_tran” is the percentage of population that uses public transit. The image shows that historically marginalized neighborhoods such as West Oakland are much more transit dependent than other neighborhoods. 2024 Poverty Status for neighborhoods in the East Bay. The map shows us that the same neighborhoods that are public transit reliant are also the same neighborhoods facing higher rates of poverty.
Barriers that Cash Reliant Folks Face on AC Transit
So, why should we care that there are cash reliant (likely un/underbanked) riders on AC Transit? These statistics are not just numbers, they are real people who are being burdened by poor policy decisions. The extra .25 cent charge is effectively penalizing cash reliant riders, making public transportation more unaffordable for the population that needs affordable transportation the most. Those with Clipper Cards are reaping the benefits that they likely are not even aware of. For riders using the Adult fare on their Clipper cards, once they spend $5.50 in one day riding AC Transit, their fare will be capped. This means that no matter how many times the AC Transit rider taps their Clipper Card in one day, the maximum amount they can spend is $5.50. The same applies for weekly fare caps ($25) and monthly fare caps ($90). Because cash reliant individuals do not have the ability to have the transit agencies track their transactions through a Clipper Card, they have to pay more for the same exact service.
In the chart below, there are four scenarios presented with two different kinds of AC Transit riders, the one who pays with their Clipper and the one who can only pay in cash. If the riders were to take three trips on AC Transit in one day, the rider with Clipper would pay $5.50 and the cash payer would pay $8.25, a whopping 50% increase in cost for the unbanked individual. If the riders were to take an average of one trip per day in a span of a month (30 trips) the rider with Clipper would pay $75 and the unbanked individual would pay $82.50, a 10% increase in cost. Overall, it goes to show that it costs more to be poor.
Ridership and Fare Payment Differences Based on Payment Type
So, why don’t cash reliant riders just transition to Clipper Card? Well, it’s not so easy. Reloading Clipper Cards is a major barrier for cash reliant folks to be able to transition. Clipper Card users can reload their cards via self-serve machines (only located at BART stations), retail locations, Clipper Customer Service Center (located in Downtown Oakland) and through remote/ autoload online. The biggest barrier to the reloading sites is the location, or matter in fact the lack of locations, especially in areas that we know are transportation dependent, low income, and likely to have more unbanked populations. The map shows us the locations where riders are able to reload their Clipper Cards and what we find is that areas like West Oakland and East Oakland hardly have any access to retail or self-serve machines. As for the reload/ autoload option, studies indicate that folks who are lower income tend to have lower access to the internet, thus making it impossible for them to be able to load their Clipper Cards. The same unfortunately goes for finding which retail locations can reload your Clipper, as the locations and map of locations is only found online on the Clipper Card website. It should also be noted that the online information for the retail locations is incorrect as many of the locations have since shut down.
Clipper Card loading locations in the East Bay and “Equity Priority Areas” (census tracts in the Bay Area with high concentrations of underserved populations). The map shows the lack of areas to be able to reload Clipper Cards, especially in neighborhoods like West Oakland and East Oakland.
What are the solutions?
While these are significant challenges that these populations are facing, they are not unfixable and there are real practical solutions that can make these systems more equitable and accessible. First, all around the country there are currently many pilot programs implementing Universal Basic Mobility (UBM). Much like Universal Basic Income (UBI), UBM is a supplemental income that is to be used towards various kinds of transportation costs such as bus fares, train fares and micromobility (i.e. bike share program) fees (D’Agostino, 2025). These programs seek to aid “transportation poverty” or the “lack of adequate transportation services to access general services and work, or the inability to pay for these transport services” (Kiss, 2022). The way that many of the UBM pilots work is that the organization running the program will supply prepaid Visa cards that are only compatible with the transportation services that they allow within the program. It acts very similar to a Supplemental Nutrition Assistance Program (SNAP) card, but for transportation costs. Programs such as these would be able to “quasi-bank” the unbanked and allow them to swipe directly onto AC Transit without having to reload a Clipper. This is due to the fact that the AC Transit system is now an “open loop” system where it accepts debit and credit cards as a form of payment in addition to Clipper. Currently, the Oakland Department of Transportation (OakDOT) is piloting a UBM program within the neighborhood of West Oakland, but the funds are incredibly limited as compared to other pilot programs happening around the country.
Universal Basic Mobility Card for a UBM Pilot in Los Angeles called “Mobility Wallet”
Another solution would be to increase the locations where folks can reload their Clipper and to make the information easily accessible and available to the public. Increasing self-serve machines at locations where we know low income populations already tend to use at higher rates such as libraries and community centers, could make it better accessible for cash reliant folks to be able to trade in their cash for Clipper funds. Additionally, it is incredibly important that AC Transit, Clipper and the MTC figure out ways to best advertise the places where reloading can be done.
Lastly, if we want to ensure that low income riders in general, not just cash reliant populations, can continue to afford AC Transit, we must expand enrollment qualifications for ClipperSTART. ClipperSTART is the needs based program that the MTC has created that gives income qualified individuals a 50% discount on all their transit fares in the 9 Bay Area counties. With data collected from the MTC, I was able to find that between September to November of 2024, only 2.17% of AC Transit riders used Clipper START. This was such an incredibly low number for a transit agency that many of us can assume serves much more than just 2.17% extremely low income folks. I found that in order to sign up for this program, individuals had to be making an income of $31,920 or below, which is 200% of the Federal Poverty Level. With the current minimum wage in Oakland of $17.34 an hour, if an individual worked a full time minimum wage job, they wouldn’t even be able to qualify for ClipperSTART. It is crucial that MTC and AC Transit seek to understand their rider demographics better and make it easier for riders that need their services the most to actually be able to use them. Moreover, if ClipperSTART is to work effectively and have a higher enrollment rate, there needs to be more ways that cash reliant communities can actually reload their Clipper START cards. All of these solutions point to a broader truth: improving public transit is not only a technical challenge, but a question of political will, priorities and most importantly money.
Fare category usage percentages for AC Transit trips using Clipper Card from September to November 2024 (MTC, 2025)
Final Thoughts
Public transportation is one of the best ways that we can reduce our carbon footprint, but that is only if we continue to fund it and improve its services. In the midst of a massive financial crisis for all transportation agencies within the Bay Area, I do worry that if SB 63, the new regional sales tax measure in the November 2026 ballot to fund Bay Area transit agencies, does not get passed, the lowest income populations that rely on these services will suffer the most. Though there are already tight budgets for transit agencies, especially AC Transit, it is worth a shot to make the services easier accessible for all their riders, including those who are unbanked and low income. The easier to ride public transportation, the more used it will be. Why have we continued to make it harder to ride public transit, especially for those who are most in need of it and how else can we fund it? These are questions I constantly ask myself and I do see some possible solutions.
Cities like Portland have implemented solutions such as the Portland Clean Energy Community Benefits Fund (PCEF) where they tax the largest retailers in the city to be able to put towards various programs including public transportation. This fund has allowed them to create a permanent UBM program within their city. Over the summer, I lobbied in solidarity with transportation union workers and everyday riders and pushed for SB 63 to be a small wealth tax instead of another sales tax put on the people of the Bay Area. Though our efforts were unsuccessful, it did bring attention to the need for more financial mechanisms (outside of yet another sales tax) to fund public transit. Speaking with other transportation planners and professionals within the field here in the Bay Area, I find that they do understand why many of the transit agencies are currently failing and find that they do really care about the riders most affected by poor policy decisions (the same policy decisions they are often pushed to make). If we are truly serious in California about reaching our climate goals, we must confront the inequities that constrain transit agencies and disproportionately burden the very populations that stand to benefit the most from these services.
During spring break last month, I visited Pittsburgh, which left me with a deep impression. The campus of the University of Pittsburgh was one of the things that amazed me. I deeply felt that this is a university that emphasizes campus design, which reflects the character of this historic steel city. The city itself also displays beautiful design elements everywhere: the landscaped waterfront corridors along the rivers, the 440+ bridges spanning the Ohio River tributaries, the preservation and restoration of traditional industrial areas, the beautiful city skyline, and the pedestrian and cyclist-friendly street environments.
In this post, I will primarily discuss the campus of University of Pittsburgh and its surrounding living environment based on my observations and experiences, while exploring why it feels so refreshing, how it embodies the concept of the sustainable community, and what comparisons it raises with Berkeley campus.
Brief Introduction to University of Pittsburgh Campus
University of Pittsburgh has a longer history than ours, founded in 1787, making it one of the few colleges established in the 18th century in the U.S. The campus is roughly 2 to 3.5 miles from Downtown Pittsburgh, depending on how you choose to travel – roughly equivalent to the distance from the Berkeley campus to Emeryville.
As shown in the picture, you could imagine that the university is a compact urban campus embedded within city blocks, tightly connected with surrounding communities, cultural institutions, medical facilities, and pedestrian street networks. It is especially intertwined with Carnegie Mellon University on its right side, forming a cluster of universities. Walking through it, it is difficult to discern whether you have already reached another university.
Campus Plan at University of Pittsburgh
Pitt’s Office of Planning, Design and Construction (PDC) has led the long-term spatial planning of its Oakland campus (main campus) in recent years. Its Campus Master Plan (CMP) serves as a 30-year development roadmap for the campus, covering seven major areas: Campus Gateways (offering opportunities for landscape features, signage, landmarks, and other orientation elements to strengthen Pitt identity and campus wayfinding), Streetscapes, Open Spaces, Mobility, Accessibility, Student housing, and History & Stewardship.
Pitt’s latest CMP was launched in 2024 with a goal to roll out by the end of 2025, while currently only the draft has been released. The PDC directly leads the campus planning, guided by a Steering Committee representing “broad cross-functional” departments and constituencies within the campus involved in the planning process. The Pittsburgh Planning Commission has also explicitly required the university to collaborate with City Planning and the Department of Mobility and Infrastructure (DOMI) during the specific site design phase. For the current 2025 CMP, Sasaki is the primary design firm.
Campus Environment and Design Highlights
Landmarks are the soul of a university. The most representative buildings on the University of Pittsburgh campus are generally considered to be the Cathedral of Learning and the Heinz Memorial Chapel; both are not only the core of the campus’s visual identity but also important symbols of the school’s history and architectural character. The Cathedral of Learning is the world’s second-tallest educational building, but unlike Berkeley’s Sather Tower, it is a place where students attend classes and study, and is also open free to visitors. Additionally, the vast lawns surrounding these historic buildings, combined with their beautiful pathway designs, are very attractive places.
Cathedral of Learning. Source: Author’s photo.Interior of the Cathedral of Learning. Source: Author’s photo.Heinz Memorial Chapel. Source: Author’s photo.
However, this is only the tip of the iceberg. What I want to highlight more is its remarkable pedestrian-friendly street system design. First, there are brand-new and clean large public transit waiting areas that feel very well-designed and pleasant, forming a stark contrast with the dirty bus stops near Berkeley.
What I appreciate most is the pedestrian crossing design near the historic landmark area and the vast open spaces it creates. The pathways wind through the space with thoughtfully chosen pedestrian-friendly paving. In my view, the most striking feature is the elevated planting beds flanking the sidewalk, which act like protective steps, offering pedestrians safety, while simultaneously slowing vehicle traffic through the road texture design.
The image below shows the other side of the street, another large newly created open space with many seats for people to chat and relax, and its usage rate is quite high.
Moving forward, you will see a newly created rest area with many bicycle racks, which makes pedestrians and cyclists feel extremely comfortable.
Additionally, I appreciate its famous dormitory complex called Litchfield Towers, with three cylindrical high-rise apartments designed to symbolize the character of the steel city, evoking memories of steel factory smokestacks.
Interestingly, its developed public transit system and frequent service schedules sometimes also cause bus congestion (it appears this segment is not yet a bus-only lane). This street is Pittsburgh’s Fifth Avenue, leading to downtown Pittsburgh which was the location of the second-largest financial street in America after New York’s in the late 19th and early 20th centuries.
Community Engagement
How does such a wonderful-looking campus advance community participation in its campus planning and construction?
The University of Pittsburgh PDC website indicates that the Steering Committee is responsible for promoting and guiding the community engagement process of the entire campus planning. The official Steering Committee members cover Administration & Finance, Planning, Design & Construction, External Relations, Athletics, Real Estate, Provost’s Office, Student Affairs, Institutional Engagement & Wellness, Research, Sustainability, Business Services, Facilities Management, as well as representative groups from Faculty Senate and Staff Council. This demonstrates that Pitt’s campus planning has become a process involving participation from academic, administrative, operational, and governance systems.
In terms of community engagement channels, the university has employed public meetings, information briefings, online survey collection, and responses to key issues in previous planning stages. The official page states that by 2024, the university had received thousands of comments, held approximately 40 meetings, and responded to over 200 online comments. This includes hosting public meetings such as public meetings and Neighborhood Enhancement Workshops, with participants including faculty, students, neighborhood residents, representatives from CMU, city government representatives, and others.
It is worth noting that in the latest 2025 campus plan, the University of Pittsburgh adopted a participatory planning tool called CoMap, which was opened in 2024 to students, faculty, staff, and community members. The 2024 CoMap survey report released on the official website shows that Sasaki, as the design firm, also participated in the design of the CoMap Online Survey. This tool uses online maps to place participants’ perceptions about the campus, routes, nodes, and suggestions onto maps. The survey received over 1,000 responses, generating nearly 7,000 map markers, over 1,900 comments, and more than 400 route suggestions.
Source: University of Pittsburgh PDCSource: University of Pittsburgh PDC
Additionally, by displaying drafts of the campus plan, the university also employed offline poster displays and on-site interactive feedback to solicit opinions. For example, the university set up display boards in public campus spaces inviting faculty, students, and community members to leave messages.
Source: University of Pittsburgh PDCSource: University of Pittsburgh PDC
Comparison and Analysis
Compared with Berkeley’s more dispersed building layout and campus structure with obvious topographical variation, the University of Pittsburgh’s compactness, strong integration with surrounding communities, walkability, and the practicality of street space design may better embody the characteristics of a sustainable community. From the perspective of being safer, more accessible, and more livable, I believe the University of Pittsburgh’s campus better reflects the design elements of a sustainable community. It largely satisfies students’ actual needs for studying, social entertainment and relaxation, and interaction with surrounding communities and the city. Its street and space renovation projects also pay more attention to design details, style uniqueness, and user experience.
In contrast, looking at Berkeley’s new building projects and some street and public space renovation projects, I see more standardized, monotonous designs. For example, the newly completed engineering buildings do not represent a significant improvement compared with previous buildings, either from a design perspective or from an actual user experience perspective.
Source: UC Berkeley Capital Strategies
Sustainable campus development must consider not only the school’s physical environment, but also socioeconomic factors such as housing affordability and crime rates. According to ACS 2024 data, UC Berkeley students face significantly higher rent pressure than University of Pittsburgh students, and the crime rate in the area is significantly higher than in Pittsburgh.
Median Gross Rent in Berkeley and Pittsburgh, 2024. Source: ACS 2024 5-year estimates, Table B25064 (universe: renter-occupied housing units)On-Campus Crime Comparison. Source: Author’s calculation based on the 2025 Annual Security and Fire Safety Reports of UC Berkeley and the University of Pittsburgh 2024 Clery Act Statistics Report
These direct factors affecting students’ educational experience and life satisfaction should be seriously incorporated into broader community engagement mechanisms and school budget allocations.
Seattle urbanists have been ecstatic ever since the recent election named Katie Wilson was elected as the new mayor of Seattle. As a transportation organizer, Wilson ran on a platform headlined “This is your city” promoting transportation justice, affordability, and vibrant community development. This is a huge win for urbanists, and honestly everyone, who are excited to imagine the future of Seattle’s public realm.
Katie Wilson. Source: The Urbanist
One conversation that has piqued the interest of many is the discussion of a pedestrianized space in every neighborhood. From Wilson’s campaign website:
“Transform our cityscape to create vibrant, people-centered public spaces
Create more car-free and vehicle-lite spaces in dense neighborhoods throughout the city, where people and families can visit, shop, play, and socialize without fear.
Pilot a “superblock” zone in the heart of Capitol Hill, diverting cars to allow walking and other modes on the street and permitting businesses to expand into the sidewalks.”
Ideas like these are promising, and rallied residents around because many Seattle residents who have been advocating for pedestrian streets for years. But what will these streets actually look like? And will we ensure these streets will actually create ‘vibrant’ public spaces?
Seattle’s Healthy Streets: Pandemic to potential
We actually don’t need to start from scratch when imagining pedestrian-centered spaces in Seattle. In response to the COVID-19 pandemic, Seattle Department of Transportation (SDOT) upgraded many existing Neighborhood Greenways to ‘Stay Healthy Streets’, closing them off to through traffic. After the program received great public support, it was announced later that year that 20 miles of ‘Stay Healthy Streets’ would be made permanent through the new Healthy Streets program. These Healthy Streets entail:
The use of the full width of the street for walking, rolling or playing while sharing the space
The use for neighborhood activities (like hopscotch and basketball) that would otherwise need to get a street closure permit for.
Hosting Play Streets and block Parties without needing a permit.
Vehicle access for people driving to get home and destinations along Healthy Streets
Potential installation of neighborhood planters that neighbors maintain.
What are these streets like? Here are a few examples:
An intersection on the Wallingford Healthy Street. Source: SDOT
Wallingford Ave: Starting out as one of the 2020 street closures, this Healthy Street is now in the process of redesign for permanent closure. The street itself runs through residential blocks, and will feature curb extensions and all-way stops at intersections in the future. Community engagement and observational study was done for these projects to judge the feasibility studies for permanent installation. Overall, this street is effective in creating a safe and healthy residential street, providing a break from vehicle traffic for pedestrians, and a space for play and other activities to happen.
This is what a majority of the Healthy Streets look like. While it is awesome that we have these spaces exist throughout the city, they truly were such low hanging fruits considering how many other streets were part of the 2020 closures. Large chunks of commercial corridors with a much larger volume of pedestrian traffic had been successful pedestrian spaces years ago, yet would require way more political leverage to achieve. The goal of 20 miles of healthy streets honestly seems very easy to achieve if they only had these types of residential streets.
Bell Street before and after construction. Source: NACTO
Bell Street: This street is a central feature of the Belltown neighborhood connecting the Waterfront to the Belltown neighborhood. People enjoy picnic tables and benches lining the street, and visit for seasonal programming like Summer music nights.
While it is part of the Healthy Street network, Bell Street was actually a project started in 2008. The move to transform this space into a shared street was initiated by community members, and it is praised for its use of community involvement in the design process.
At the time, the community involvement of the street was honestly very progressively thinking. Yet, the street itself does not maintain the community-led feel. In one way, street programming isn’t community led. Instead, events like Summer music nights are hosted by the Seattle Downtown Association (and other large entities) who have stricter guidelines/processes for what programming happens in downtown spaces. This severely limits informal/community uses of the space. While the street provides a great space that welcomes pedestrian activity, it lacks the space for community to actually happen.
‘placemaking’ as product
I think this is a good time to talk about ‘placemaking’. The Project for Public Space describes Placemaking as the collective reimagining and reinvention of public space by communities. The concept of ‘placemaking’ has become pretty popular in recent years, finding its way to many different projects and discourse about public space. The term itself isn’t very specific, not referring to any specific outcome, so it’s only fitting that the word has become a sort of a buzzword for any public realm improvements.
I came across this short article published by the Project for Public Space titled “Placemaking Is Dead, Long Live Placemaking!” that articulates how the term ‘placemaking’ has gone from a verb to a noun, turning an approach into a thing
“But with ‘placemaking’ becoming ever more confined to grant-funded and project-based efforts, ‘placemaking’ ends up being one-shot additions; single events; or short-lived, dead-end pilots. With no mechanisms for continuation, the chance of those efforts having lasting impact is low. Unsuspecting communities, clients and professionals alike are led to believe they are getting something much better and more impactful than what really materializes, and the results are disappointing”
I think this article begins to articulate a lot about how public realm projects move through communities. It’s not even just the term ‘placemaking’, the use of buzzwords feels like new speak. Although SDOT doesn’t claim ‘placemaking’ in their projects, consider the “Healthy” part of the “Healthy Streets”. Perhaps during the lockdown era it meant having space to go outside safely, promoting physical activity. But today, it feels diluted. Does deprioritizing cars on already residential streets really promote community health in a meaningful way?
I think back to the Making Healthy Places chapter “Social Capital and Community Design” by Killam and Kawachi, which asserts that “social capital affects health through the exchange of social support, collective action, and the maintenance of social norms to promote healthy behaviors”. In thinking about designing spaces for community health, there needs to be an emphasis on a process that promotes building community capacity even after design and construction— not only a product.
A good example: Little Brook
So there is at least one Healthy Street project that does actually stick out as a model for future pedestrian-centered streets in Seattle. Little Brook Street in the Lake City neighborhood was a project requested by community members, starting out as a 3-month pilot in 2021.
The project was overwhelmingly popular and is now under construction for permanent installation. What sets Little Brook apart from the other Healthy Streets is the partnership that SDOT nurtured with the community. Partnering with organized community members in the Lake City Collective, a grassroots neighborhood group, they were able to co-design features in the space including gardens and community-relevant artworks. The Lake City Collective, now leads programming of the space, with activities like basketball, gardening, wellness classes, and movie nights. The street has built important community connections and has been a genuinely big part of building neighborhood pride in one of the most car-centered neighborhoods in Seattle. This grassroots-public partnership is the kind of community empowerment that I believe is necessary for these streets to be truly “Healthy”.
Pictures from Little Brook Street. Source: SDOT
Reframing the future
Healthy Streets (and similar programs across the country) can be starting points for building a network of pedestrian-centered spaces, but more is needed to develop the community capacity that is important for vibrant and resilient communities.
We need to move away from the end goal of more car-free spaces, and instead focus on how we will arrive there. Imagine teh vibrant neighborhoods that could be achieved if the goal was “Build community capacity around car-free and vehicle-lite spaces in dense neighborhoods throughout the city, where people can participate in community-led programming”. I’d imagine community mobilization, local governance, stewardship, neighborhood pride. That would be real placemaking.
As the world continues to move toward electrified infrastructure, doing so for a multitude of reasons (paramount being decarbonization), access to energy has become a basic human right. Kaisa Hutha, in the Nordic Journal of Human Rights, asserted that “energy is fundamental to all human activities…[and that] needs such as clean water, cooking and nourishment, adequate housing, modern healthcare, contemporary agriculture, communication, and transportation are all entirely dependent on access to affordable energy” (Huhta 2023). Within this framing of energy as an essential resource, affordability is key to ensuring sustainability for communities, with sustainability defined as the ability to “[meet] the needs of the present without compromising the ability of future generations to meet their own needs” (United Nations Brundtland Commission 1987).
However, due to rising energy costs throughout the world, it is becoming increasingly difficult for the identification of truly sustainable communities through this lens. Across the globe, customers have been subjected to increasing energy prices (specifically electricity), with countries like Bermuda, Ireland, and Italy possessing the three highest electricity rates across the world at $0.47, $0.44, and $0.42 per kilowatt-hour (kWh) respectively (World Population Review 2026). Interestingly, though retail prices have continued to rise across the globe, the wholesale cost of electricity has actually decreased following an international spike in cost in 2022 (Figure 1), likely a result of more incorporation of renewable energy sources like solar, wind, and hydro (International Energy Agency 2025).
Figure 1. Quarterly average wholesale prices for selected regions, 2018-2026 (IEA 2026)
This “inverse” phenomenon is troubling as it inherently inhibits the development of truly sustainable communities. Narrowing the scope of this article to the United States, specifically California, we see this trend on a harsh scale. To date, California has one of the highest residential electricity rates in the United States, currently sitting at $0.31 per kWh in April 2026 (Energy Bot 2026). Traditional, and arguably outdated, affordability metrics, like energy burden, fail to truly express the extent of energy insecurity and vulnerability within the state.
The United States Department of Energy’s Low-Income Household Energy Burden tool maps California as possessing among the lowest energy burden in the United States at 4% – 6% of statewide average income (U.S. Department of Energy 2018). However, sensitivity & exposure and system reliability performance metrics like cost of disconnection and experienced-based measures, as posed by the Kleinman Center for Energy Policy, reveal that over 25% of California families experience energy insecurity, determined by the number of households that have had “force[d] tradeoffs between paying utility bills and buying essentials” (Alameda County Department of Public Health 2018; U.S. Department of Energy 2018).
It is quite the paradox to conceptualize the fact that over one quarter of the state with the fifth largest global economy experiences energy insecurity. It is especially interesting to digest this fact, against knowledge that the state of California has one of the “cleanest” (or most renewable) and therefore cheapest energy grids from a wholesale production perspective. This means that utilities like Pacific Gas & Electric (PG&E) are well positioned to offer lower electricity prices to consumers, but fail to do so in order to maximize shareholder value, reporting a net income of $2.59 billion in 2025, a 4.8% increase from 2024 (Pacific Gas & Electric 2026). This clearly communicates the priorities of public utilities and makes a strong case for decentralized, community-owned and operated assets in the name of sustainability.
Legislative Barriers
With an understanding of the need for more affordable energy, with supporting literature that dates back as far as the 1980s, it is important to grasp the structural and legislative barriers that have restricted or outright prevented community-led development, specifically within California. The two most relevant policies in California are California Public Utilities Code (PUC) 218 and PG&E’s Net Energy Metering (NEM), both of which prevent and restrict development, respectively.
PUC 218, enacted January 1, 2009 regulates the generation and distribution of electricity generated within the State of California. This rule restricts the “use or sale of electricity between more than two corporations or persons” within the State (State of California 2008). Under this regulation, the act of “over-the-fence[ing],” or the process by which a private entity or homeowner, could generate electricity and sell it to a neighbor, is prohibited. Private entities that engage in this behavior are subjected to the same fees, penalties, and regulations as PG&E and other large corporations, which, for customers already experiencing insecurity, is unsustainable. This rule, therefore, forces customer reliance on public utilities, promoting the reign of their monopolies, while restricting energy independence and affordability.
PG&E, like other large public utilities in California, has introduced a net energy metering policy, the most relevant being NEM 2.0 and NEM 3.0. The NEM Program was originally created in 1996 following the passage of SB 656 to incentivize the adoption of solar panels by offering retail credits for excess energy generation (California Public Utilities Commission n.d.). Under the NEM 2.0 mandate, a homeowner could purchase and install solar panels on their homes to offset the amount of electricity that would need to be purchased from the public utility. System owners could then sell any excess generation back to the public utility for the same retail price that they present to customers (PG&E Corporation n.d.). This transformed solar adoption within the state, for those that could afford the systems, as homeowners could now become fully independent from a public utility and maximize their return on investment (ROI).
Directly resulting from policies like NEM, California grew to generate 36.7% of statewide electricity from solar (Solar Energy Industries Association 2025). However, in 2022, likely motivated by corporate greed, PG&E introduced NEM 3.0, a new policy that restricted the sales tariff of solar electricity sold back to the utility to the wholesale procurement rate that PG&E pays for electricity. This, as expected, led to a sharp decline of solar adoption, shown in Figure 2, and has also led to, on average, 75% less earnings for customers selling their electricity to the grid (California Public Utilities Commission n.d.; Wigness 2025).
Figure 2. NEM/NBT Solar PV Projects Per Year, Past 10 Years (CPUC n.d.)
Legislative Solutions
These regulatory bottlenecks are both jarring and draining as they prohibit the realization of sustainable communities and energy security. Fortunately, to combat PUC 218, there are companies, like Ava Community Energy, referred to as community choice aggregators (CCAs), that produce electricity at lower prices than PG&E, often at least 5% lower than the typical cost of generation from a public utility (California Community Choice Association 2024). Under most CCA generation structures, communities are still subjected to procure power from large utilities, not solely from a CCA, per 218 mandates. Of course, charging $95 rather than $100 per month can only go so far for one quarter of the state that is already experiencing vulnerability, but these are still savings that otherwise would have gone to the shareholders of PG&E.
Cities and local municipalities have also begun to offer solar and battery storage incentive programs to help promote the adoption of this technology by communities that cannot afford these solutions. Programs like the State of California’s Go Green Financing offers homeowners zero-interest loans to procure and install solar systems on their homes, with fixed payment plans, with rates subject to income and solar production (State of California n.d.). These programs are indeed helpful at bridging the gap between populations in need, and increasingly essential services, but often fail to reach low-income, non-homeowning communities that are still subjected to high rates.
Non-Legislative Barriers
The barriers to community energy development extend beyond the legislative and corporate settings, but are rooted in systemic and qualitative challenges as well. Notable among these challenges is the high upfront cost of electrification. The median cost of a decentralized energy system in the United States in 2023 was $24,350 (Rewiring America 2023). In California, many homeowners cannot afford to take on this expense, and many renters in the state are not even positioned to consider the investment. This cost barrier, combined with a lack of education and investment of knowledge into low-income, minority communities subjects marginalized and vulnerable populations across the state of California and across the nation to exponentially increasing energy prices, making sustainability unattainable.
With knowledge of these barriers, cities across the State of California have sought to introduce initiatives that can remove the high upfront costs of community energy development, increase education, and provide access to affordable, renewable energy. Programs like Los Angeles Department of Water and Power’s (LADWP’s) Community Solar Program offer a framework, shown below in Figure 3, where community members can subscribe to receive power at a fixed-rate from a portion of an LADWP-owned solar grid (either 50 kWH or 100 kWh) to support renewable energy adoption and potentially realize savings (Los Angeles Department of Water and Power 2019). Programs across the state have sought to expand upon this model at numerous scales, from neighborhood to city-wide, particularly targeting marginalized populations.
Figure 3. LADWP Shared Solar Program Overview Diagram (LADWP 2019)
However, limitations of this widely-accepted framework include the restriction of energy independence and autonomy due to commercial ownership and fixed procurement limits. Along with that, the inequitable fixed-rate structure ignores income and seasonal variations. Chief among the limitations of this model is that the generation and subsequent savings from solar are unevenly distributed across consumers. This program structure, while seeking to break down barriers that restrict energy access, possesses bottlenecks that can further the energy insecurity that many consumers face across the State of California.
Paths Forward
Community energy generation is the key to sustainable communities, but it is constrained by policy, economics, and infrastructure bottlenecks. So where do we go from here?
The first step is to encourage regulatory and political reform, specifically toward PUC 218. This legislation is the most restrictive and prevents generation independent from the public utilities. Potential pathways for reform could be to allow for the private generation of electricity and sale to no more than 10 separate consumers, restricting the size of private generators, and requiring that those systems are interconnected to a public utility grid in the event of an off-nominal event, ensuring reliability.
For the regulation of large utilities, it would be powerful to see a cap placed on the profits of public utilities like PG&E and for electricity rates to move at a proportional relationship to the development and use of cheaper, renewable energy-based systems. For every grid-scale renewable system that attains “prepared-to-operate” (PTO) status, tariffs decrease by $0.01.
From a development perspective, the path forward has a bit more complexity. There is significant value in current “community solar” programs like that which is operated by LADWP. The programs are uniquely positioned to provide tremendous benefits for consumers, but need critical changes. The first and most important change that needs to be made is the restriction on power procurement. When a customer is currently subscribed to a solar site, they often sign a 5-, 10-, or 15-year agreement, with exceptions for renters. The program enrollment is often capped at a set number, based on the size of the solar system. Owners like LADWP should take the generation potential of the system and determine how to equitably distribute the generation of the energy across subscribers to ensure maximum relief and minimized energy burden. It would also serve these programs well to remove a fixed-rate structure and move toward a variable accounting system that considers both income and economic volatility along with seasonal variations and climate change.
To fully realize sustainable communities from an energy perspective, there are a multitude of things to be done and changes that can be made, as discussed above. However, the absolute first step in solving the problem of energy vulnerability, is to recognize not only that it is a problem, but to acknowledge how close to home this problem sits. One in four people in the state of California alone, the state with one of the largest global economies, experience this insecurity. So how much more must this problem persist in other states, countries, and regions? The realization of these challenges and the humanization of those affected, people that may be in the same room or building as you read this article, is the beginning of the movement toward sustainable energy communities.
References
Alameda County Department of Public Health. “Energy Insecurity and Health: Reducing and Avoiding Disconnections.” 2018.
State of California. “GoGreen Financing.” California Energy Efficiency Loans for Homes & Businesses | Go Green Financing, https://www.gogreenfinancing.com. Accessed 6 April 2026.
United States Department of Energy (DOE): Office of Energy Efficiency and Renewable Energy. “Low-Income Household Energy Burden Varies Across States – Efficiency Can Help in All of Them.” 2018.
Graffiti covers the concrete openings like paint daubed over old wounds — still visible, but just barely. Step closer, and there’s nothing behind the iron bars: no animals, just cold shadows, puddles, scattered trash, and a fast-food wrapper plastered flat against the wall. From somewhere down the slope, a few voices drift up. A couple has spread a picnic blanket right in front of what used to be the lion’s cage, tossing food back and forth like it’s any other Sunday afternoon.
It was a foggy winter day in 2025. We’d been a little disappointed by the weather in L.A., so we asked Reddit/AI to recommend somewhere interesting to explore.We drove up a winding road, dust trailing behind us, until the land opened up into a hillside. As we made our way up the trail, I started to wonder — is there actually an old zoo up here?
An empty cage at the Old LA Zoo, its concrete and steel now layered with graffiti instead of animals.
Graffiti‑covered stairway leading into one of the Old Zoo’s underground passages
Old Zoo and the Story Behind It
Then it came into view: a black metal fence and some artificial rockwork. I climbed up to the bear grotto and found a tiny pool, iron cages — and standing there, I could almost picture the animals crammed inside. The graffiti covering the walls reminded me that humans had left their mark here too. This place didn’t feel like a typical zoo, and it didn’t quite fit my idea of Griffith Park either. I started asking myself: what kind of past are we actually sharing this space with? When a city turns a violent history into a “ruin landscape,” who gets to consume that haunted feeling?
I was standing in a scene that looked perfectly natural and recreational — but underneath me was the historical residue of animal waste, sewage, trash, and landfill.
This “fun little hillside” was originally imagined as the seed of a world-class zoo. The Griffith Park Zoo opened in 1912 on the site of Griffith’s old ostrich farm, but it started with almost no municipal budget, the most basic fencing, and a drainage system that barely worked. By the 1950s, the zoo was packed with thousands of animals, still housed in concrete caves and iron cages. Animal mortality was high, sewage leaked out, and there are records of wastewater flowing into the Los Angeles River — drawing criticism from journalists and federal inspectors alike.
In 1966, a new zoo opened two miles away. The animals were moved, and the old site was closed — but not demolished. It was simply left on the hillside: some enclosures got picnic tables, some structures were sealed off, and the rest were left for plants and graffiti to slowly take over. In the decades that followed, the site kept getting pulled into new planning debates — from repeatedly failed park master plans, to a proposed outdoor performing arts center on the old zoo lawn, to more recent rezoning tied to zoo expansion. Each time, city agencies framed their projects around “public culture,” “youth services,” or “ecological improvement.” And each time, community groups like Friends of Griffith Park pushed back through hearings, letters, and CEQA lawsuits, arguing for urban wilderness and habitat protection.
Managed Ruin under the Context of Dark Ecology
After I got back, I came across an article a friend had shared on Chinese social media — it was about “dark ecology.” Suddenly, that strange, unsettling beauty I’d felt at the Old Zoo had a name. Historically, things like animal captivity, sewage discharge, and landfills — all that “dirty” stuff — were pushed to the edges of cities. In Mary Douglas’s terms, they were “matter out of place”: filth that the urban order refused to acknowledge. But in the Anthropocene, that pollution and violence never actually went away. It just changed shape and location. We have always lived on a damaged planet, alongside all of it.
The city didn’t erase that filth — it managed it into something you could visit. Iron cages, concrete, graffiti, and picnic blankets now exist side by side. Urban metabolism scholars describe cities as living organisms: they take in energy, food, and building materials, and they excrete wastewater, waste materials, and solid waste, accumulating heavy metals and nutrients, acting as thermodynamic reservoirs for carbon, nitrogen, phosphorus, and more. Standing at the Old Zoo, I felt like I was at one of those exhaust-and-burial points in L.A.’s urban metabolism — a place where the old zoo, Toyon Canyon landfill, roads, and parking lots all converge.
Seen this way, the Old Zoo’s managed ruin isn’t some rare anomaly. It’s the everyday condition of ecosystems that have been abandoned and repurposed under human control. On a damaged planet, there is no truly pristine “nature” — only different forms of coexistence and management.
The same pattern shows up across Los Angeles. Toyon Canyon landfill inside Griffith Park was capped, covered with soil, planted with native species, and rebranded as a “passive recreation meadow.” The Taylor Yard freight depot along the L.A. River became Rio de Los Angeles State Park. The old Cornfield rail yard was fought over and turned into Los Angeles State Historic Park. Each of these places, like the Old Zoo, has buried its history — animal captivity, freight cars, oil fields, landfill — beneath layers of soil and concrete, then retold that history in the language of “parks” and “urban nature.
Who Gets to Sit with the Ghosts?
Even if we’re willing to use the language of dark ecology to face these ghosts, there’s a more uncomfortable question underneath: who actually has the access and resources to come here and do that?
The Griffith Park Vision Plan frames the entire park — including the Old Zoo area — as “urban wilderness,” emphasizing native plant restoration, habitat connectivity, and biodiversity, while positioning it as a site for environmental education. The proposed lawn stage at the Old Zoo has been justified in planning documents and press coverage through phrases like “free public cultural programming,” “improved ADA accessibility,” and “a safer, more welcoming public space.” By those metrics, Griffith Park does look like a public space. But through the lens of just sustainabilities and park equity, it’s also a deeply unequal one.
The Old Zoo, when it was still a zoo, was a space of one-directional power: humans — especially those with the leisure time and money — watched captive animals from a safe distance. A century later, the animals are gone, the enclosures are ruins, and the dynamic has shifted. City managers manage the ruin; visitors come to experience it, to reflect on animal ethics and urban ecological history. The subject of the gaze has changed.
But exclusion doesn’t disappear — it just takes new forms. Who has the privilege and resources to participate in this kind of modern “reflection”? Who can drive or take a rideshare to Griffith Park on a weekend, spend two or three hours picnicking in an old animal cage, and come away thinking about dark ecology? As Just Sustainabilities consistently argues, even “progressive” green projects reproduce inequality if they don’t seriously account for access and equity. We may be rethinking our relationship with nature — and there’s a new, optimistic narrative emerging both online and on the ground. But who is the “we” in that sentence? Who gets counted?
Old Zoo Located in an Area not Quite Accessible to Public Transportation
Research on L.A. County confirms what this feels like on the ground: high-quality green space and large public parks are concentrated in wealthier neighborhoods, while low-income communities of color are consistently underserved. The media often celebrates Griffith Park as one of the city’s great assets — but that asset is not equally within reach for everyone.
There’s also a quieter form of exclusion rooted in safety. Griffith Park — large, semi-wild, and unevenly patrolled — has a long history of conversations about nighttime safety, unhoused residents, and police presence. Plenty of visitor guides recommend coming with a group, during the day, and parking close to where you’re going. That advice is itself a kind of soft exclusion. I can’t say for certain that I would come here alone. The same space that feels like “romantic wilderness” to some people can feel isolated, unfamiliar, and potentially unsafe to others — especially if you come from a community with a long history of over-policing or surveillance, where the idea of walking alone in the hills at night carries a completely different set of risks.
After the Ruins: What Now?
Grimm closes with the idea of reconciliation ecology: in heavily human-altered environments, the goal isn’t to fantasize about returning to some pre-human state, but to design and manage spaces so that human use and biodiversity can coexist as well as possible.
Standing on that hillside, I could feel exactly that — a “managed ruin.” The old structures are still there, visitors wander through concrete caves, the surrounding vegetation is slowly recovering, and some species have quietly moved back into the gaps. It’s a rough, half-accidental kind of reconciliation — no grand restoration project, no interpretive signage explaining any of it — but in practice, humans and damaged nature are already sharing the same space.
What if we treated the Old Zoo as a starting point for reconciliation ecology, rather than an endpoint? Right now, the managed ruin runs mostly on spontaneous regrowth and minimal community upkeep. The city’s Department of Recreation and Parks does just enough — trimming branches, maintaining fences, clearing fallen trees — to keep people from getting hurt and the city from getting sued. The bigger vision gets handed off to Friends of Griffith Park, to visitors, and to time. If reconciliation ecology is genuinely the goal, then shouldn’t the Vision Plan, the zoo expansion, and the performing arts center treat this hillside as a real experiment in ecological and historical coexistence — rather than just open space available for the next facility?
And who gets invited into that reconciliation? If we take just sustainabilities seriously, reconciliation isn’t just about building coexistence between educated middle-class visitors and sparrows. It means asking: could shuttles, programming, and community partnerships bring teenagers and seniors from park-poor neighborhoods into the conversation too — people who could also have a say in reimagining what this land is for?
For me, the most powerful thing about the Old Zoo is precisely that it refuses to offer a clean ending. It’s not a model restoration success story, and it’s not a forgotten ruin either. It’s a place that keeps oscillating between dark ecology, just sustainabilities, and the realities of day-to-day management. Maybe bringing that kind of questioning back to zoos that are still operating — still making decisions right now — is harder than standing in the ruins and reflecting on the past. And maybe more important.
For those of us studying and practicing planning in cities, the goal isn’t to restore every old facility to perfection. It’s learning to stop in front of a managed ruin like this one and ask: what version of nature and history did we choose to preserve? Who did we let in to live alongside these ghosts? And next time — can we put those questions on the table from the very beginning?
On January 7th, 2025 massive fires erupted across Los Angeles’ urban-wildlife interfaces and submerged the city and its millions of residents in toxic smoke. 31 people were killed, 200,000 people were displaced, and 18,000 homes and structures were destroyed. Residents didn’t have reprieve from toxic air for weeks.
L.A. air quality map during the January 2025 fires.
The local government was not prepared for a fire disaster of this scale. The previous year, the city reduced the fire department budget by $17.2 million. A month before the Palisades Fire was ignited, the fire chief warned the budget cut was hindering the department’s emergency response abilities. Soon after the fires started, residents began criticizing the government for having a sluggish emergency response, a critical failure an independent report later supported.
Despite the well-known threat of fire in the region, the Red Cross and LAPD at one of the city’s largest evacuation centers did not have masks available to protect evacuees from the toxic smoke plaguing the region – arguably the biggest immediate threat to the community’s health aside from contact with fire itself.
When the government fails to do its job, communities only have each other to rely on. If you’re lucky, local grassroots networks are prepared to step up and fill gaps left by unjust policy, bad politics, and bureaucratic inefficiency.
Fortunately for L.A. residents, when officials dropped the ball on protecting them, a small group of community members building mutual aid networks since the start of the COVID-19 pandemic stepped in to provide air filtration tools.
All over the country, mask blocs – scrappy, all-volunteer collectives, often made up of a small group of disabled community members – have been fervently collecting and distributing PPE (personal protective equipment), air purifiers, and more to people seeking access to resources that keep them safer from airborne illnesses and other air quality hazards. Over the last six years, these collectives have been bidding in auctions for pallets of masks forgotten in backs of government warehouses, rerouting unused PPE headed to the landfill from industrial facilities, and building relationships with manufacturers to obtain surplus at lower costs.
Mask Bloc LA member Abby Mahler, image via The Sick Times
These organizations might have a few thousand dollars or less in the bank at any given time, but they are who Mayor Karen Bass turned to for respirator masks while millions of Angelenos inhaled toxic smoke. (Ironically, the same mayor who proposed a mask ban policy months prior during a COVID surge.)
Bruh. LA government reached out to @MaskBlocLA for help distributing masks and the mayor is still thanking corporations.
Reminder that mutual aid groups are the ones responding to this emergency with urgency while leaders prioritize "looting" and pandering to corporations. https://t.co/gbnmq14XtM
On January 14th – nearly a week after the fires ignited – Mayor Bass tweeted that masks would soon be made available across the city. By the time of the tweet, a single mask bloc had already distributed over 40,000 masks. A week later, the same group had distributed nearly 300,000.
While the official response stumbled, the community filled even more catastrophic gaps. Small business, community members, grassroots organizations, and mask blocs sprang into action, creating a complex, responsive network of emergency resource collection and distribution nodes across L.A. county. Food, medical items, respirator masks, diapers, formula, personal hygiene items, clothing, shelter, funds, and much more. Countless community members dropped everything and worked around the clock for weeks to sustain this massive, coordinated, community-driven emergency response.
A never-ending, fast-moving line of cars formed outside a bike-repair-shop-turned-emergency-aid-distribution-center – one of hundreds of informal aid hubs operating throughout the fires. Parking lots and family homes became sites for DIY air purifier builds, which were immediately distributed to locations with the least access to clean indoor air. A mutual aid Discord server exploded, allowing individuals across the city and state to coordinate instantaneously. With road closures, evacuation sites, resource hub status, and community needs changing rapidly, this online gathering space allowed folks responding to stay on top of what was needed where and react accordingly.
Wildfire relief pop-up for those affected by the Eaton Fire, at Santa Anita Park in Arcadia, California, image via Truthout
MALAN, a hub for mutual aid efforts in L.A., built out a massive public spreadsheet tracking informal and formal donation hubs for weeks. [The spreadsheet is no longer filled, but if my memory serves me, there were 100 or more locations included]. What was available to pick up, what donations were needed, what items should the community cool off with supplying, what were the location hours – all these were live-updated to instantly inform thousands of effective actions.
The response network stretched beyond L.A. Once the fires started, masks and DIY air purifier materials began to run out in local stores almost immediately. In response, a small group of autonomous Bay Area organizations that distribute masks and other harm reduction supplies teamed up with small businesses and individuals to create an emergency response network referred to as Bay to L.A. Within days of the fires starting, the group had begun collecting depleted supplies and trucking them to L.A. in personal cars and rented vans, in coordination with organizers on the ground in L.A.
Bay to L.A. van collecting box fans for DIY air purifiers
It may seem like the community’s sophisticated emergency response collective sprung up out of thin air. The network was informal, unregulated, and what it managed to do was astounding. But it wasn’t out of nowhere. Preexisting grassroots groups working outside the “mainstream” over years and decades – many of whom already knew or worked with each other outside of acute disaster – had created the foundation. Without them, I’m not sure an effort of this scale, speed, and responsiveness would have been possible.
Grassroots response networks can accomplish astonishing things, but they don’t exist in a vacuum. They rely on social connection and a deep knowledge of the ecosystems that make up a place – social infrastructure, neighborhood resources, road networks, local cultures, landmarks, community hubs, informal community figureheads, and more. It’s clear in the case of L.A. that these systems played a decisive role the community’s resilience through disaster – a core component of what makes a place sustainable, especially as climate threats escalate.
If community response relies on connection, then a truly sustainable community is, non-negotiably, a well-networked one. It’s a society where real connections are made, and where grassroots organizers – unencumbered by bureaucracy – have the freedom to act. A landscape where systems of mutual aid are already in place – flush with community gardens, food distribution networks, housing support, harm reduction resources, and more, all led by community members. A place where residents have enough rapport to know each other’s needs in advance of disaster and be able to work together through the fear and urgency of life-or-death situations.
“We know that there’s so many crises on the horizon, so it really is just about creating this infrastructure, these relationships and little nodes of connection before a crisis actually happens, and then sustaining it long term,” – organizer Navneet Kaur in an interview with Truthout.
I’m not suggesting there isn’t a need for coordinated, official responses to disasters. Grassroots organizations won’t be sending aerial firefighters into the sky. I’m also not suggesting that the existence of mutual aid networks excuses institutional failure to provide basic needs. However, if we know that grassroots networks are a fundamental part of the disaster response landscape, then we must acknowledge how the way our cities and policies are designed to prevent or foster social connection has serious implications for future climate crises.
From zoning and land use laws constructing barriers to community kitchens and urban gardening, to car centrism and a lack of third spaces preventing natural social interaction, to the criminalization of harm reduction programs and police targeting of mutual aid organizers – the ways bureaucrats and officials consider social connectivity and grassroots efforts have an impact far beyond day-to-day community programs. They also influence disaster resilience outcomes. I see the grassroots response to the L.A. fires as a call to action for officials. It’s a message to acknowledge that community networks can be more effective than governmental agencies in crisis and that sometimes the best thing to do is to get out of their way.
On paper, the opening of San Francisco’s Sunset Dunes Park in April 2025 represents a triumph of the human over the vehicle: what was once a highway has been transformed into a 2-mile, 50-acre car-free promenade, complete with a skatepark, outdoor gym, and lots of public art. But don’t let the stunning beachfront vistas and Instagram photo ops fool you – the pedestrianization of this roadway sparked a bitter political battle between residents and outsiders perceived to have steamrolled residents’ legitimate opposition to the park’s creation. The ongoing conflict cost one city Supervisor his job and continues to divide residents in the city’s otherwise sleepy, suburban west side. To understand the conflict, we need to return to this park’s genesis, which (like many other transformative, recent land use changes) began during the pandemic.
But first, a little context about the area. Prior to the pandemic, the Upper Great Highway was a major thoroughfare connecting the Richmond district to the South Bay, allowing drivers to avoid alternate routes filled with stop lights and stop signs. The highway occupies prime real estate, as it sits between the Lower Great Highway on the east and the beachfront on the west. The Richmond and Sunset districts that bookend the Great Highway share many similarities: both have high populations of elderly residents and families; both are rife with multigenerational living arrangements; and both are poorly serviced by the city’s public transit routes. In short, the residents of these neighborhoods, many of whom have longstanding roots in the community, were (and continue to be) highly reliant on cars for transportation. The Great Highway, vulnerable as it was to climate change, erosion, and constant inundation by sand, was an important connection between these neighborhoods, the rest of the city, and the peninsula.
Map of the current Sunset Dunes park is shown in blue. At the time this image was generated, the park was still under consideration, hence why it does not yet have a name. Source: SPUR
In spring 2020, the city closed the Great Highway to cars at the request of then-Supervisor Gordon Mar, with the intention of creating a community space for safe outdoor recreation during the pandemic. The closure, which was originally intended to be temporary, was popular, as reflected by a 2020 study which found that the park averaged over 3,600 weekday and 6,800 weekend trips by pedestrians and bikers. At this point, the city gathered public feedback to determine the future of the roadway and held a town hall in November 2020 for presentation of the city’s traffic management plans, open Q&A, and polling of public opinion on the park and its future. In March 2021, the city held an open house to present five potential plans for the roadway and socialize their overall evaluation approach focused on “climate change resiliency, well-being and health, transit first/sustainable mode choices, equity, Vision Zero, and economic vitality.” Since I was unable to find additional substantive information on the meetings themselves, I’m unable to comment on how accessible they were (other than the fact that they were held during the pandemic, so it was undoubtedly limiting, especially to immuno-compromised residents). But it’s important to note that the city even held these public input meetings at all – note the foreshadowing for what’s to come!
Following these public meetings, the city administered a survey via website, email, and social media to better understand community preferences about the park’s future. Again, to offer my own brief commentary on the public input design, the lack of snail mail here certainly skewed the responses by limiting the engagement from elderly residents, who are important stakeholders in this process, as mentioned above. This shortcoming notwithstanding, nearly 4,000 people responded to the survey (about 95% of whom were SF residents) and the results are interesting. In the Richmond and Sunset, the two neighborhoods directly connected to the Great Highway, opinions were mixed. 52% of Sunset residents supported closing the road to cars entirely and only 22% supported a full return to the pre-pandemic normal roadway, in contrast with the Richmond’s residents, the majority of whom supported the return to a highway for cars, not people. These numbers contrast with the rest of the city, who overwhelmingly favored complete pedestrianization, with only 11% of residents in favor of returning to a vehicular roadway. Following these community engagement sessions, the city opted to take a middle ground: they opened the roadway to drivers on the weekdays and closed it in favor of pedestrian use on the weekends. This change was implemented as a pilot program with a scheduled sunset date in 2025 to allow “Recreation and Park Department and the SFMTA to collect more robust data on the Upper Great Highway’s use as both a roadway and a promenade, as well as gather additional public feedback.” Again, foreshadowing!
(I’m having trouble uploading the table of survey results, but you can find them here, on PDF p. 42/72.)
In 2024, extensive erosion forced city officials to close the Great Highway Extension at the southern end of the Great Highway pilot park. The closure of this section of road, which had never been closed for recreation, severely hampered the Great Highway’s usability as a vehicular thoroughfare to Daly City. To seize upon the momentum from this unexpected occurrence, five city Supervisors (including Joel Engardio, who represented the Sunset) proposed a ballot measure to permanently close Great Highway to cars – not just on the weekends, but all the time. This measure (Prop K) ignited a bitter political firestorm that divided Sunset residents and ultimately led to Engardio’s recall from the Board of Supervisors in 2025 (his successor has vowed to reopen the Great Highway to cars, to no avail thusfar). So as not to bury the lede, I will state the obvious: after months of intense campaigning, the ballot measure passed with 55% support, and the Great Highway was christened in 2025. The voting patterns, however, are striking and indicate the Sunset and Richmond’s deep-seeded frustration with the park and the lack of community input in determining its future. As shown below, the Richmond and Sunset voted overwhelmingly in opposition to the park, while those farther from the park with much less to lose from the situation (myself included, I will admit) voted in favor. (Again, image upload issues, but please scroll down to the “Prop K” results to see the voting pattern map – it’s powerful, I promise!)
I think it’s easy to waive away the no-park crowd as car-pilled NIMBYs with a typical, conservative opposition to change of any kind. In reality, I think we need to take a deeper look at the reasons for their opposition, which indicate a more nuanced position. From commentary on Reddit (which is quite rich, I highly recommend reading the thread linked below), conversations with SF residents, and quotes from prominent no-park advocates, the main reasons I can surmise are the following. First, many residents feel that there was no need for a park, at least on the weekdays – especially when the weekend model seemed to be working. As mentioned above, residents also stressed that the Great Highway closure diverts traffic onto local roads, which increases traffic and facilitates unsafe driving behavior in residential areas. And finally, some residents feel that the Great Highway park permanently dashed any hopes of a Muni line connecting the Richmond and the Sunset (while I would love if this happened, I will admit that this view seems hyper-optimistic and unrealistic). One anonymous Reddit commentor summed up the no-park stance well, writing that “in all reality there is no NEED for a park right next to a massive beach. It’s just something that certain people WANT because they don’t understand the implications of closing a major thoroughfare and they don’t live in the community that the potential park would be located so they don’t have to deal with the consequences.”
Ultimately, I feel that the beautiful park by the sea was marred by the Supervisors’ decision to push a ballot measure that decided the fate of the Great Highway without input from community residents most connected to the roadway. For me, this process really emphasized that it’s not always as black-and-white as bike vs. car. And it also emphasized that in circumstances like this where the city/locale fails to adequately account for community input in the design of a ballot measure, voters have a critical responsibility to educate themselves on the perspectives of those most affected by the ballot issues. While the debate over the park’s future remains as vociferous as ever, I think this whole saga offers an important lesson for us as fledgling planners on how (or perhaps, how not) to approach major changes in land use.
Have you ever sat on the grass at Cedar-Rose Park? Ever ridden your bike on the Ohlone Greenway from Cedar-Rose to Strawberry Creek Park? Grabbed coffee at the cafe at Strawberry Creek or played tennis on the courts behind the grass? Enjoyed the community gardens along this path? I celebrated a friend’s birthday in Bancroft Community Garden recently, heard about the history of this strip of land, and felt compelled to learn more.
From 1904 until the late 1950s, there was a railway called “The Oakland Local,” built by the Santa Fe Railway. This train carried both passengers and freight between Point Richmond and Oakland, running diagonally through Berkeley. When the railway was retired due to increasing car use, the City of Berkeley was able to purchase the land in 1977 when citizens approved “Measure Y.” This measure provided $500,000 for the City to acquire and develop the 3.1-mile strip of the Sante Fe Railroad Right-of-way (ROW). The intent was always to turn the space into “park land, housing, and to sell to neighboring residents,” as the City Council approved the development.
Map of the Santa Fe ROW (Source: Rails-to-Trails Conservancy)
The TL;DR of the subsequent development looks something like this (cue the fast forward button ⏩): Cedar-Rose Park and Strawberry Creek Park are built (1980s), several housing projects are built leading to community members passing Measure L to keep the corridor as an open space (1986), the North Berkeley section becomes the BART route and is developed into the Ohlone Greenway (1980s-90s), the corridor between Bancroft and Channing becomes a community garden currently known as the Bancroft Community Garden (early 1990s), a section is parceled and sold to the Berkeley Montessori School (2001), and Spiral Gardens received permits from the City to be a model urban garden center (2003). Thus, the South Berkeley section of the Sante Fe ROW was bounded by Cedar-Rose Park on the North side and Spiral Gardens on the South end. The rest of the corridor between Channing Way and Ward Street has been left undeveloped and fenced off for decades, though not from a lack of desire from the community.
Satellite map of the undeveloped blocks of the ROW (Source: Rails-to-Trails Conservancy)
While there has always been interest in the corridor being turned into a greenway (including an idea for an orchard dating back to 1998), a UC Berkeley City Planning course in 2003 and a Landscape Architecture class in 2005-2006 conducted analyses on the Santa Fe ROW that helped catalyze the community into organizing and advocating for the development of the space. What was notable from the analysis from the city planning course’s report was the data they looked at on ethnicity and income around the ROW neighborhoods. While this data may be outdated, it does show race data (“a relatively high concentration of African Americans and Pacific Islanders in the Oregon-Dwight section of the right-of-way”) and income data (ranging from 11% to 18% of the population below the poverty line).
The SFROW fenced off (Source: MSBF)
By the end of 2006 and through 2009, many community based organizations became involved, including Berkeley Partners for Parks, Rails-to-Trails Conservancy, the Berkeley Community Gardening Collaborative, several other community organizations, and then-Mayor Tom Bates. As the planning process began, a city walk of the area drew more than 40 people. This process continued as community organizing and city officials continued to meet, with community-wide support for parks projects such as the Sante Fe ROW. In 2013, there was a lengthy public process with extensive community testimony culminating in the City Council considering putting on the 2014 ballot a “potential $20 million parks bond in conjunction with a 10% increase to the existing parks tax after a unanimous vote Wednesday night by the city’s parks commission.” This measure would support all of the parks within Berkeley, including the development of the ROW. Hundreds of community members engaged in the process, attending hearings and supporting the organizations leading the charge for park support. Eight Berkeley council members had pledged to support the combined tax and bond measure. However, in July of 2014, the City Council shocked community members by voting to only put the parks tax on the ballot without the bond measure. The tax would only provide enough money to maintain current park services rather than expand new park land. Community members were left frustrated and disillusioned after the City Council’s decision appeared to contradict nearly a year of public engagement and consensus in public will.
From here, the progress went quiet until 2020, when Moving South Berkeley Forward (MSBF), a Berkeley youth-driven environmental, social justice project focused on community health and educational equity in South Berkeley, took on the mission of transforming the Santa Fe ROW into a green space and community garden. MSBF is a joint effort between the Berkeley Community Gardening Collaborative (from the Ecology Center), UC Berkeley’s Environmental Science, Policy & Management Department, Berkeley High School, and the community of South Berkeley.
Finally, on December 8, 2021, Berkeley was awarded a $5 million competitive grant from Round 4 of the Statewide Parks Program (SPP) for the development of the Sante Fe ROW for a project titled “the Santa Fe Railroad Trackbed to Parks Conversion Project.” Over the previous year, the City’s Parks, Recreation & Waterfront Department had executed a community process involving the input of over 130 community residents.
A 2021 rendering of the Concept Plan (Source: City of Berkeley)
The rendering of the proposed greenway includes a space for community garden plots, a dog park, a play area for children with a cycle track and a play structure, and a community garden space with an outdoor classroom.
Five years after receiving the grant in 2021, Berkeleyside shared in January 2026 that the park might be finished within the calendar year. The city has started the soil remediation due to slightly elevated arsenic levels. The updated designs for each of the blocks are below:
Block 1: Community Garden Plots (Source: PGAdesign)Block 2: Children’s Play Area (Source: PGAdesign)Block 3: Dog Parks (Source: PGAdesign) Block 4: Community Garden and Outdoor Classroom (Source: PGAdesign)
Following this project has brought a lot of the sustainable planning and environmental justice themes forward for me. Firstly, southwest Berkeley was a historically redlined area, with lower income averages and higher BIPOC populations. It has also been well researched that the area has less greenspace, trees, and canopy cover. As a result, the southwest neighborhood has frequently been the target audience for grants like the city’s Trees Make Life Better Program, which supports the free planting of trees in specific neighborhoods. This neighborhood has been historically not prioritized for development and the ROW occupies some of the last remaining undeveloped greenspace in the city of Berkeley, meaning that this space is ripe with potential to do something equitable for the community.
Another point that stood out loudly for me was the participatory process for the planning. It seems like many community groups, community leaders, and community based organizations were heavily involved in this process throughout the 20 years of getting this greenway to come to fruition. The engagement from community members to attend meetings and put their energy and effort into being invested in the planning process should not be undervalued. At the same time, from my learnings in the participatory planning process course, the biggest thing to remember from a planning perspective is that after you gain trust, you must be trustworthy, to maintain that trust and relationship with the community. The 2014 bond measure being left off of the ballot seems like a major faux pas that rocked the community stakeholders and likely a big reason that the project went quiet for many years thereafter. The city’s electeds were criticized for dismissing the community input and months of hearings and commission recommendations as well as public advocacy for park projects were disregarded. I’m unsure whether the city and community would have picked this project up again without the state grant to move it forward.
What are your thoughts? Do you think the city and community members and organizations would be able to come together again to mobilize the city to raise the funds through taxes/bonds had state funding not come through? Overall is this a good example of participatory planning engagement without the 2014 ballot snafu? What level of participation do you think this is?
I was pleasantly surprised to learn how involved UC Berkeley has been throughout this process, from engaging students in community projects that ultimately mobilized community organizing to supporting MSBF. Above all, I am personally very excited to see the corridor come to life, hopefully very soon. It sounds like a green space that support urban agriculture, education, and third space convening. You can track the project status of the Santa Fe Trackbed to Park Conversion on the City of Berkeley’s Capital Improvement Projects webpage.
Over the past century, modern urban design has increasingly prioritized vehicular infrastructure at the expense of the human experience, resulting in reduced opportunities for social interaction, diminished equity, and a weakening of human connections in our communities. In 2020, as the world experienced unprecedented shutdowns, a significant change in urban living took place, prompting Oakland residents to reevaluate their surroundings. This led to a crucial question: What happens when a city’s most beloved public space suddenly becomes its most essential one?
In Oakland, California, the pandemic reshaped daily life in ways that were both painful and unexpectedly revealing. Before 2020, Lake Merritt was already a beloved gathering place—a loop for joggers, a weekend picnic spot, a cultural crossroads where drum circles, birdwatchers, families, and food vendors all shared the shoreline. However, beneath its picturesque surface laid deep-seated racial inequities and policing tensions that reflected the broader societal challenges of a rapidly gentrifying city. Oakland has experienced intense gentrification over the past two decades, as rising housing costs displaced many longtime residents—particularly Black and Latino communities (Chapple & Zuk, Urban Displacement Project, UC Berkeley). As wealthier newcomers moved into neighborhoods surrounding the lake, questions about who truly “belonged” in public space became increasingly visible.
Urban Displacement Project – Lake Merritt Displacement Typology Map
When COVID‑19 shut down indoor life, Lake Merritt became something more than a scenic landmark; it became Oakland’s living room. With social interactions shifting outdoors, it became a refuge for thousands of residents, particularly those from under‑resourced low-income communities, who sought exercise, connection, and a semblance of normalcy. While the pandemic brought profound tragedy and disproportionately impacted low-income black and brown populations, it also highlighted the critical role of shared public spaces. Streets, parks, and plazas emerged as vital infrastructure for these communities, serving as essential lifelines for connection and resilience during such challenging times when so much was off‑limits.
Lake Merritt revealed a truth that had long been overlooked in cities like Oakland: access to inviting, equitable outdoor space is not a luxury—it is a lifeline. The spontaneous gatherings, informal markets, and community rituals that flourished around the lake during the pandemic echoed a broader national shift. From pedestrian plazas in major cities to street closures in small towns, communities everywhere were reimagining public space as essential to social connection, health, and urban vitality.
Lake Merritt’s Unseen Economy: Equity, Enforcement, and Community Resilience
As the COVID-19 pandemic swept across the globe, it triggered unprecedented job losses and the shuttering of countless businesses, leaving many people scrambling for ways to support themselves. In this challenging environment, vendors who relied on bustling marketplaces, street corners, and community gatherings suddenly found themselves in increasingly vulnerable situations, grappling with the harsh realities of financial insecurity (National Employment Law Project. Pandemic Job Loss and Informal Economies, 2021).
Informal vending at Lake Merritt became normalized during the COVID-19 pandemic through a combination of economic necessity, community acceptance, and gradual institutional recognition by the city. What began as informal survival strategies eventually evolved into semi-organized markets and pilot programs that acknowledged vending as part of the lake’s social landscape.
In an interview with KALW Public Radio, Oakland vendor Jame Copes described how the lake became a critical economic lifeline for residents who suddenly found themselves unemployed during the pandemic.
“People were just trying to survive… Lake Merritt became a place where you could still connect with the community and make a living.” (KALW, 2021)
Oakland native and Lake Merritt vendor, Jame Copes.
Similar to past racial tensions around the lake, during the pandemic, this new sense of community and culture quickly turned into an issue of equity and access. Local residents began to express concerns and grievances about how the lake was being used and by whom. Calls for stricter enforcement occasionally surfaced, echoing earlier conflicts about who should be allowed to occupy public spaces around the lake.
Instead of perceiving the activities around the lake as chaotic or disorderly, community organizations reframed them as vital expressions of resilience and survival within their neighborhoods. By issuing public statements, organizing community gatherings, and hosting mutual aid distribution events, these groups passionately advocated for a more compassionate and less punitive approach to law enforcement. They underscored the potential repercussions of increased policing and stringent regulations, particularly emphasizing how such measures could disproportionately affect Black, Brown, immigrant, and low-income residents who depend on Lake Merritt not just for their livelihoods but also for social interaction and connection.
While these organizations did not always share identical goals, their combined presence helped shape a broader public conversation about how Lake Merritt should function during a time of crisis. Together, they helped shift the narrative away from strict enforcement toward a more nuanced approach that recognized the lake as a shared civic commons—one where economic survival, cultural expression, and collective stewardship could coexist during an unprecedented moment in urban life.
Balancing Access and Stewardship: Planning the Next Chapter of Lake Merritt
Oakland city planners and community partners are increasingly recognizing that the future of Lake Merritt will require collaborative governance rather than purely top-down regulation. Planning efforts led by the City of Oakland Planning and Building Department, Oakland Parks, Recreation & Youth Development (OPRYD), and community stewardship organizations such as the Lake Merritt Institute emphasize the importance of balancing public access with environmental protection and community input (City of Oakland, 2021; Lake Merritt Institute, 2022).
Current discussions focus on strategies that acknowledge the lake’s role as both a cultural gathering space and a sensitive ecological habitat. These efforts include exploring clearer guidelines for vendor activity, improving waste management infrastructure around the lake, expanding volunteer stewardship and cleanup programs, and strengthening communication between residents, vendors, and city agencies (City of Oakland, 2021; Oaklandside, 2021).
Lake Merritt therefore offers a powerful case study for the future of urban commons in Oakland. Its pandemic experience demonstrated that public spaces thrive when they are actively used, socially vibrant, and collectively cared for. The growth of informal vending, community gatherings, and volunteer stewardship programs during the pandemic revealed both the opportunities and challenges of managing shared civic landscapes (Oaklandside, 2021; KALW Public Media, 2021). Moving forward, planners and community advocates increasingly argue that the goal should not be a return to the pre-pandemic status quo, but rather building on what the crisis revealed: that inclusive, flexible, and community-centered approaches to public space management can allow access, culture, and environmental stewardship to coexist (City of Oakland, 2021).
By embracing this balance, Oakland has an opportunity to shape Lake Merritt—and other public spaces across the city—into models for how cities can design and manage shared environments that are both equitable and resilient. As urban sociologist Eric Klinenberg notes, “well-designed public spaces serve as critical forms of social infrastructure, strengthening community ties and collective resilience during times of crisis” (Klinenberg, 2018). The next chapter of Lake Merritt will depend on continuing to treat the lake not only as a park, but as a living civic landscape shaped by the people who gather along its shores.


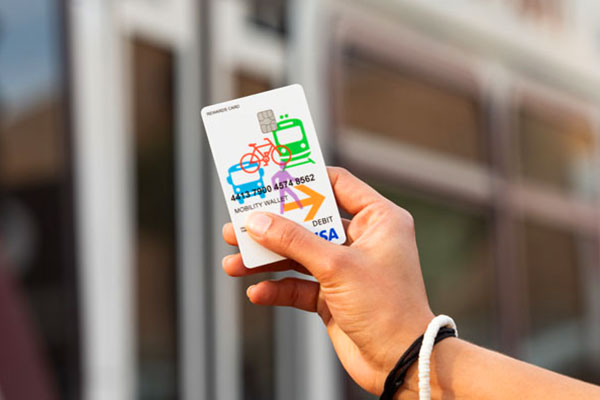




You must be logged in to post a comment.